
Why sampling rate matters in modern distribution networksSponsored

Electricity distribution networks operate at 50 Hertz, but many of the events that determine how well those networks perform occur on timescales far shorter than a single 20-millisecond power cycle.
For decades, conventional measurements such as root mean square (RMS) voltage, current, power and energy have provided utilities with a reliable picture of network operating conditions. Those measurements remain essential.
But as New Zealand's distribution networks accommodate more solar generation, battery storage, electric-vehicle charging, variable-speed drives and other power-electronic equipment, they no longer tell the whole story.
Why sampling rate matters in modern distribution networks
The reason is simple: 50 Hz defines the network's fundamental operating frequency, but not the full bandwidth of its electrical behaviour.
Modern inverters and electronically controlled loads make decisions and switch semiconductor devices on millisecond and microsecond timescales.
Their interaction with transformers, cables, filters, capacitors and other connected equipment can create electrical signatures extending from a few kilohertz to hundreds of kilohertz.
Slower monitoring systems may accurately record that voltage or current changed, while missing much of the detail needed to explain how the event developed or how connected equipment responded.
That distinction is becoming increasingly important for electricity distribution businesses.
An RMS voltage of 230.4 volts is a useful and meaningful measurement, but it does not uniquely describe the waveform from which it was calculated.
Two waveforms can have almost identical RMS values while containing very different levels of harmonic distortion, converter switching components, impulsive disturbances, resonance, post-event oscillation or intermittent arcing.
In other words, RMS describes the magnitude of the waveform, but not its instantaneous shape, timing, or high-frequency content.
This creates a measurement challenge. No single ideal sampling rate fits every network-monitoring application.
If the sampling rate is too low relative to an event's duration or frequency content, important behaviour may be missed completely.
But continuously recording every voltage and current channel at megahertz rates creates another problem: enormous quantities of data that must be processed, stored and potentially transmitted.
The objective, therefore, should not simply be to sample as fast as possible; it should be to apply the right temporal resolution to the right part of the event.
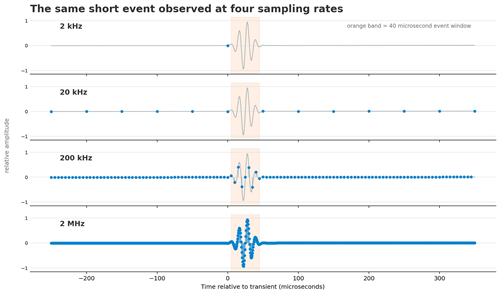
Consider a disturbance lasting 40 microseconds. At a 2 kHz sampling rate, a new sample is taken every 500 microseconds, meaning the entire event could occur between two samples and never be observed.
At 20 kHz, the 50-microsecond sample interval is still longer than the disturbance. At 200 kHz, the broad shape of the event begins to become visible. At 2 MHz, approximately 80 sampling intervals occur across the same disturbance, preserving its internal oscillatory structure, rise time, and decay with much greater fidelity.
The important principle is that information not captured at the point of measurement cannot be recreated later.
Cloud analytics, digital signal processing and artificial intelligence can extract patterns from recorded data, but they cannot reconstruct waveform information that the measurement chain never preserved. Sufficient bandwidth and time resolution must therefore exist before higher-level analytics can add value.
One approach is staged, multi-rate event capture.
Nexbe has implemented this concept in its RaptorVision™ architecture. Rather than recording an entire event window at 2 MHz, the highest sampling rate is concentrated around the disturbance itself. Moving away from the event, the sampling rate progressively reduces from 2 MHz to 200 kHz, then 20 kHz and finally 2 kHz for the wider pre-event and post-event context.
The complete capture extends across approximately 30 power cycles. This provides high temporal resolution where it has the greatest diagnostic value, while retaining enough surrounding information to show how the network entered the disturbance and how it recovered afterwards. It also substantially reduces the memory, storage and communications burden compared with recording the complete event continuously at the highest sampling rate.
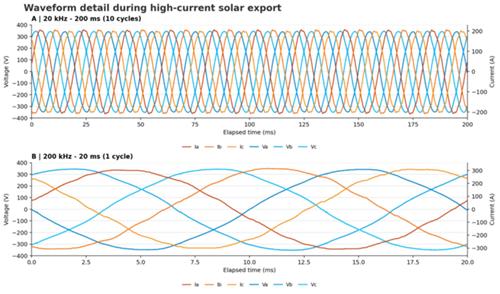
Field measurements from a 200 kW solar farm illustrate why multiple sampling rates can be useful.
A 20 kHz waveform capture spanning ten 50 Hz cycles provides enough duration to assess persistence, phase balance, repeatability, and the overall voltage-current relationship. A 200 kHz capture concentrates ten times more samples into a single cycle, revealing finer in-cycle structure.
During high-current export, the three-phase voltage remained close to sinusoidal while the current showed a repeatable waveform shape. The ten-cycle record showed that the behaviour persisted, while the higher-rate record made it possible to examine the detailed voltage-current relationship within an individual cycle.
The same site also demonstrated why operating context matters.
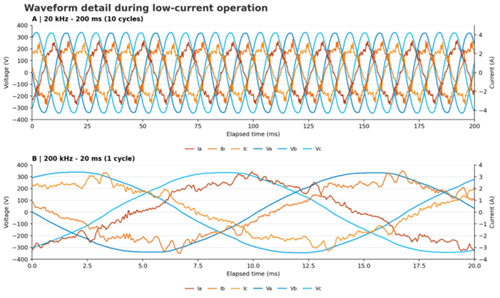
At low solar output, current was only a few amperes per phase, yet the waveform appeared more irregular because converter-control and switching-related components represented a greater proportion of the total current.
Without considering the current scale, active and reactive power, and the operating state of the inverters, the waveform could easily be misinterpreted as more severe than it was.
This points to a broader opportunity for distribution networks.
The value of higher-rate monitoring is not limited to investigating individual events. Repeated observations across different operating states can establish what normal electrical behaviour looks like for a particular transformer, feeder, solar farm or distributed energy resource.
Over time, that measurement history can become a behavioural baseline. Future events can then be compared not only against fixed voltage or current thresholds, but against the established behaviour of the asset and its surrounding network.
For EDBs, this opens a path from traditional power-quality monitoring towards continuous fault monitoring. High-rate acquisition provides the evidence, embedded processing turns that evidence into useful measurements and features, and long-term history provides the context needed to recognise when behaviour begins to change.
The network still operates at 50 Hz. But as power electronics become increasingly dominant, understanding what happens within and around each power cycle will become an increasingly important part of understanding the network itself.
For further information, please reach out to: Rob Stuart, CTO, Nexbe Limited rob.stuart@nexbe.nz or, go to https://nexbe.nz/